
- November 25, 2013
Many Eyes states: “Information visualization is a complex research area. It builds on theory in information design, computer graphics, human-computer interaction and cognitive science.
Practical application of information visualization in computer programs involves selecting, transforming and representing abstract data in a form that facilitates human interaction for exploration and understanding. Important aspects of information visualization are the interactivity and dynamics of the visual representation. Strong techniques enable the user to modify the visualization in real-time, thus affording unparalleled perception of patterns and structural relations in the abstract data in question.”
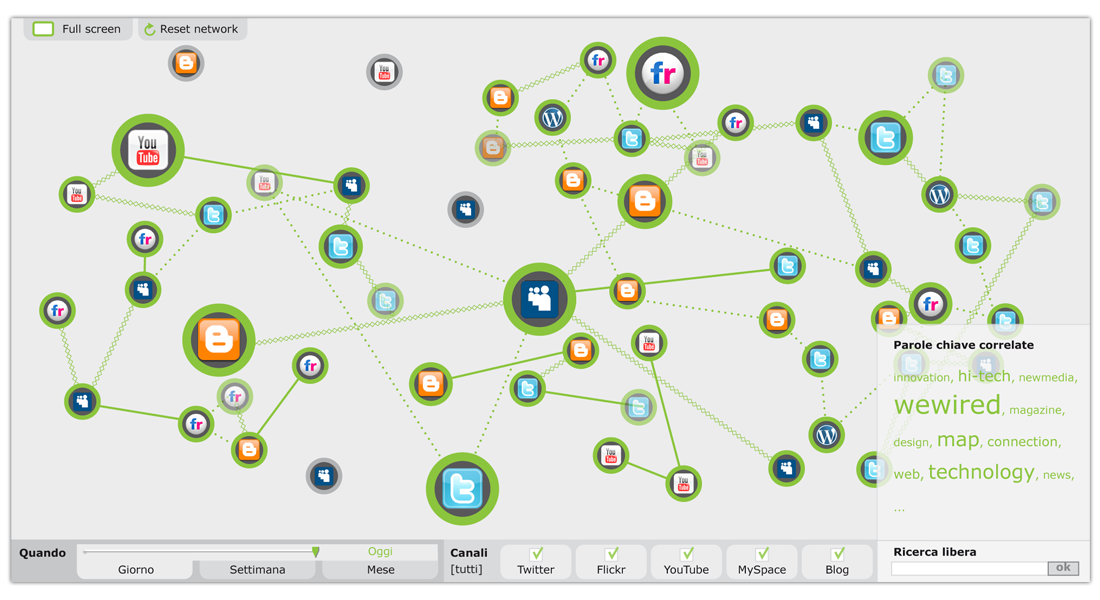
One of the most successful online tools I worked on was a 2009 teaser campaign visualizing the conversation on Social Media about the upcoming brand new product.
The design pattern chosen for better describing the connections between each actor was the node graph. The size of each node and the type of connection also added more qualitative information. The whole graph could be filtered both by time and by source.
The user could build up its own representation by browsing the tool and by selecting the nodes and conversations he was interested with.
[/symple_column]